


The 2024 Indie & AA Games Market: What 5,000+ Games Reveal About Success & Failure
Data-Driven Insights on Genre Success, F2P Performance, and the Role of Publishers

After diving into the top 50 AAA, AA, and Indie games of 2024, I received a ton of feedback with one request: Go bigger. Well, you asked, and after an unhealthy amount of coffee and more late nights than I’d like to admit here it is. This time we’re analyzing a massive dataset of over 5,000 AA, Indie, and Hobbyist games released on Steam in 2024.
This deep dive covers everything from revenue trends and F2P insights to genre performance, publisher vs. self-published success rates, and key takeaways for devs planning their next moves in 2025. If you’re looking for cold, hard data (served with a side of friendly analysis), you’re in the right place. Let’s get into it.
Data Context
The data used in this analysis is sourced from third-party platforms GameDiscoverCo and Gamalytic. You can access the full dataset in this Google Sheet.
In 2024, approximately 18,000 games were released1 . After applying the following filters, the dataset was reduced to 5,773 games:
Released in 2024
Classified as AA, Indie, or Hobbyist
Generated at least $500 in revenue
The most significant reduction came from filtering out games that made less than $5002, bringing the total down from 18,000 to 6,509. This highlights how elusive commercial success is for the majority of developers.
Additional Filtering
I also filtered out games that had the the following criteria:
Outliers classified as AA or Indie but not representative (e.g., Marvel Rivals, Black Myth: Wukong)
Non-English games (some may have slipped through, but most were filtered out)
Data Weirdness
If you see ??? in the Name, Developer, or Publisher fields, it’s due to character encoding issues (e.g., Japanese, Chinese, TM logos). This also sometimes caused the Steam link to sometimes be placed in the developer box for some reason, this doesn’t affect the data so just ignore it.
Classification of AA, Indie, and Hobbyist Games
Since I used Gamalytic’s filtering to collect this data, we will be using their definition for these groups:
Hobbyist: Any publisher who made less than $10k lifetime on Steam.
Indie: Publishers who made more than $10k and less than $50m lifetime on Steam.
AA: Publishers who published at least 2 games, made more than $50m and less than $500m lifetime on Steam.
For the purposes of this article the status of AA, Indie, or Hobbyist has less to do with studio size and more to do with experience. They also based their definition on the publisher rather than the developer.
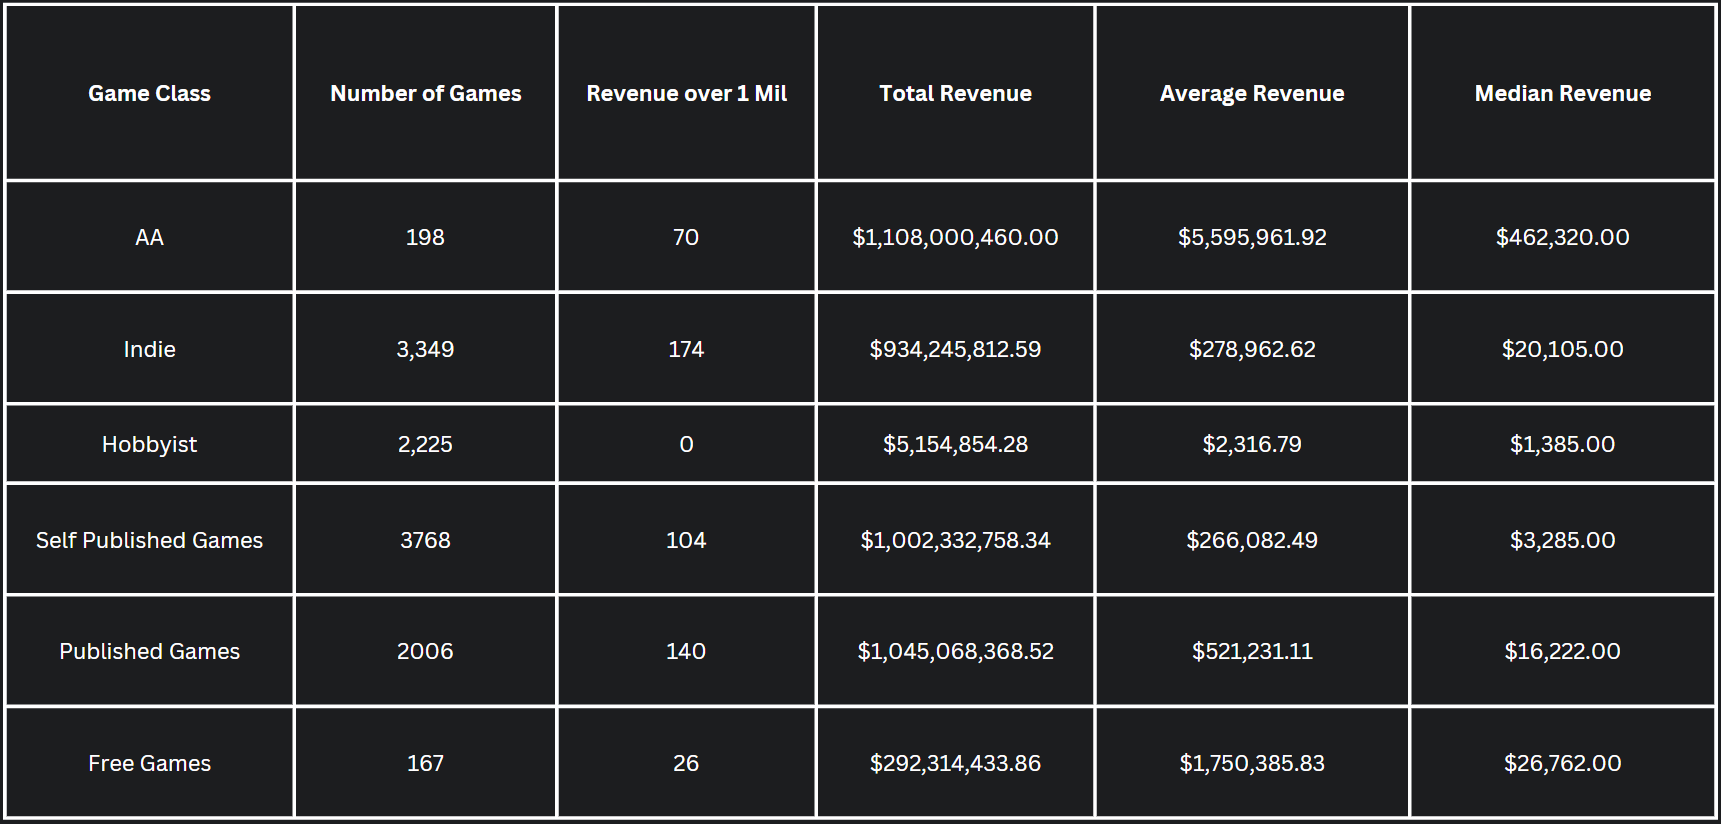
Key Performance Comparisons: AA / Indie/ Hobbyist
Revenue Distribution
Revenue is heavily concentrated in the top-performing games for Indie & AA games.
➡️ 83.92% of total AA revenue comes from the top 10% of AA games.
Top 5 AA games by revenue:
Warhammer 40,000: Space Marine 2 – $133,864,019.00
Path of Exile 2 – $129,024,321.00
The First Descendant – $114,750,661.00
Manor Lords – $73,896,051.00
S.T.A.L.K.E.R. 2: Heart of Chornobyl – $70,285,910.00
➡️ 84.98% of total Indie revenue comes from the top 10% of Indie games.
Top 5 Indie games by revenue:
Gray Zone Warfare – $35,989,824.00
Balatro – $27,973,428.00
Supermarket Simulator – $27,136,298.00
Chained Together – $22,177,462.00
TCG Card Shop Simulator – $20,278,635.00
➡️ 32.27% of total Hobbyist revenue comes from the top 10% of Hobbyist games.
Top 5 Hobbyist games by revenue:
Polismos – $9,946.00
Pleasure Thieves – $9,945.00
Helbreath Nemesis – $9,892.00
Two Apples – $9,863.56
Days With Ollie – $9,813.00
Revenue Concentration: This data reflects a winner takes all market where a small number of games are capturing a majority of the market.
Pricing Trends
AA: Typically priced between $20-$30
Indie: Commonly priced under $20
Hobbyist: Consistently priced below $10
Indie games display the widest range in pricing, reflecting differences in perceived content value.
Engagement Insights
Unfortunately I ran into errors collecting the average playtime and ultimately decided to remove it as it would take far too long to manually validate the data for so many games. Here’s what I learned from the accurate data I did collect.
It’s no surprise that the order of most to least playtime was AA - Indie - Hobbyist. Indie & AA playtimes were significantly less than the playtimes in my previous Top 50 AAA, AA, & Indie games in 2024 article. It’s hard to say if this is because games that take longer to complete and/or have high replayability are more likely to do better or if great games are naturally played longer. Probably a combination of both.
Free To Play Insights
Massive F2P live service titles (LoL, Fortnite, Apex Legends) have existed for years and are basically printing money, so I was curious to see how non AAA F2P games are performing.
Usage in AA, Indie, & Hobbyist Games
Total F2P games: 167
AA F2P games: 8
Indie F2P games: 120
Hobbyist F2P games: 39
Revenue Impact
Average revenue per F2P game: $1.7M
Median revenue per F2P game: $26K
Lucrative F2P Genres
Multiplayer: Appears in 80 titles with a total of 334 Million USD
Action: Appears in 57 titles with a total of 307 Million USD
Online Co-Op: Appears in 38 titles with a total of 306 Million USD
Shooter: Appears in 19 titles with a total of 272 Million USD
RPG: Appears in 73 titles with a total of 257 Million USD
Adventure: Appears in 57 titles with a total of 231 Million USD
Single player: Appears in 90 titles with a total of 230 Million USD
Sexual Content: Appears in 17 titles with a total of 219 Million USD
Single player was the most surprising genre to me on this list. Usually when you think of F2P titles you think of live service multiplayer PVP focused titles. Turns out a few of them had single player tags but were still focused on multiplayer PVP, like DeltaForce, Stormgate, and Enlisted. However most of them were proper Single player experiences.
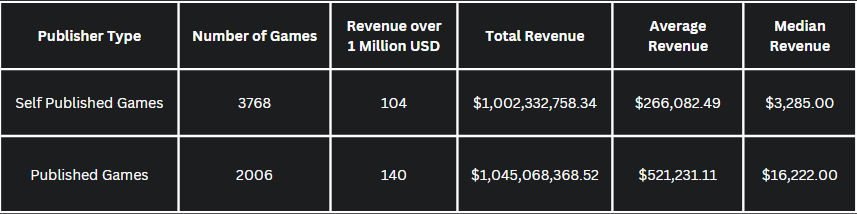
Self Published vs Published Games
I’m not gonna lie, I love a good underdog story so I was rooting for self published games, but its pretty clear from the data that games with a publisher performed better overall. Despite significantly more self published games, games with a publisher had a higher total revenue, average revenue, and median revenue!
Publishers can be a huge help. They can help fund your game, localize it, port it, and handle marketing for you. But before you take this as proof that signing with a publisher guarantees success, let’s take a step back. The most important element in your game’s success (including marketing) is the game itself. Is it fun? Is it appealing? Is it bug free and well optimized? But before you take this as proof that signing with a publisher guarantees success, let’s take a step back.
Publishers aren’t picking games at random. They’re investing in winners, games they believe will sell well and make them money. Meanwhile, self-published games are shipping whatever their creators manage to finish. So, naturally, the publisher-backed games have a better track record, it’s almost a statistical inevitability.
If you find yourself in a situation where multiple Publishers are coming to you rather than the other way around, it’s a strong sign you’ve got something special. But before handing over 40%3 of your revenue, take a hard look at what they’re actually bringing to the table. If their marketing, distribution, and platform connections can significantly boost your game’s success, the trade-off might be well worth it.
The math is actually in publishers favor. Lets use some napkin math and assume a publishing contract where the publisher is pocketing 40% of your revenue. The median revenue for a published game in our dataset is $16,222. Take away 40% ($6,489), and you’re left with $9,733, which is still three times more than the median revenue of self-published games ($3,285). That checks out with what Mirko, an indie dev I interviewed told me about his publishing experience:
“I’d rather have X percent of a big pie than 100 percent of a small pie”
Genre Insights – What Worked in 2024?
Most Profitable Genres for AA, Indie, & Hobbyist Titles
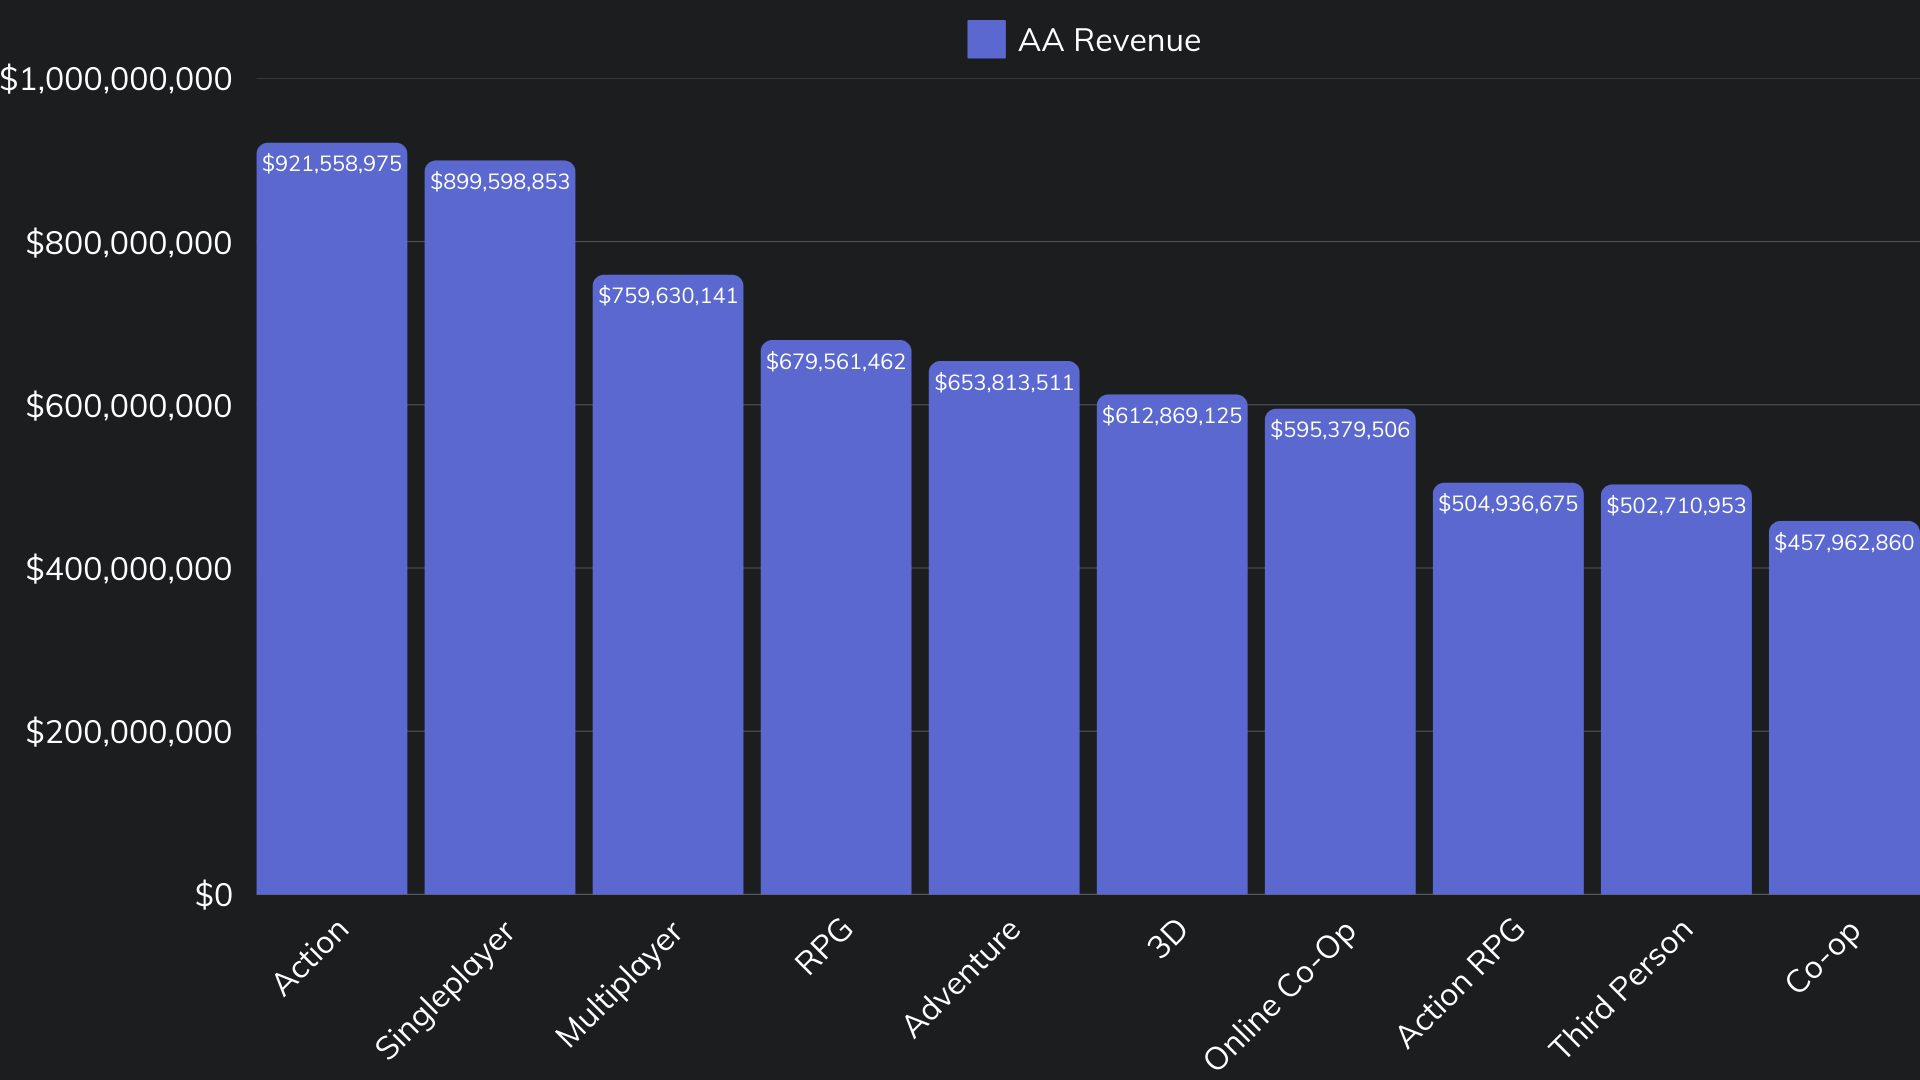
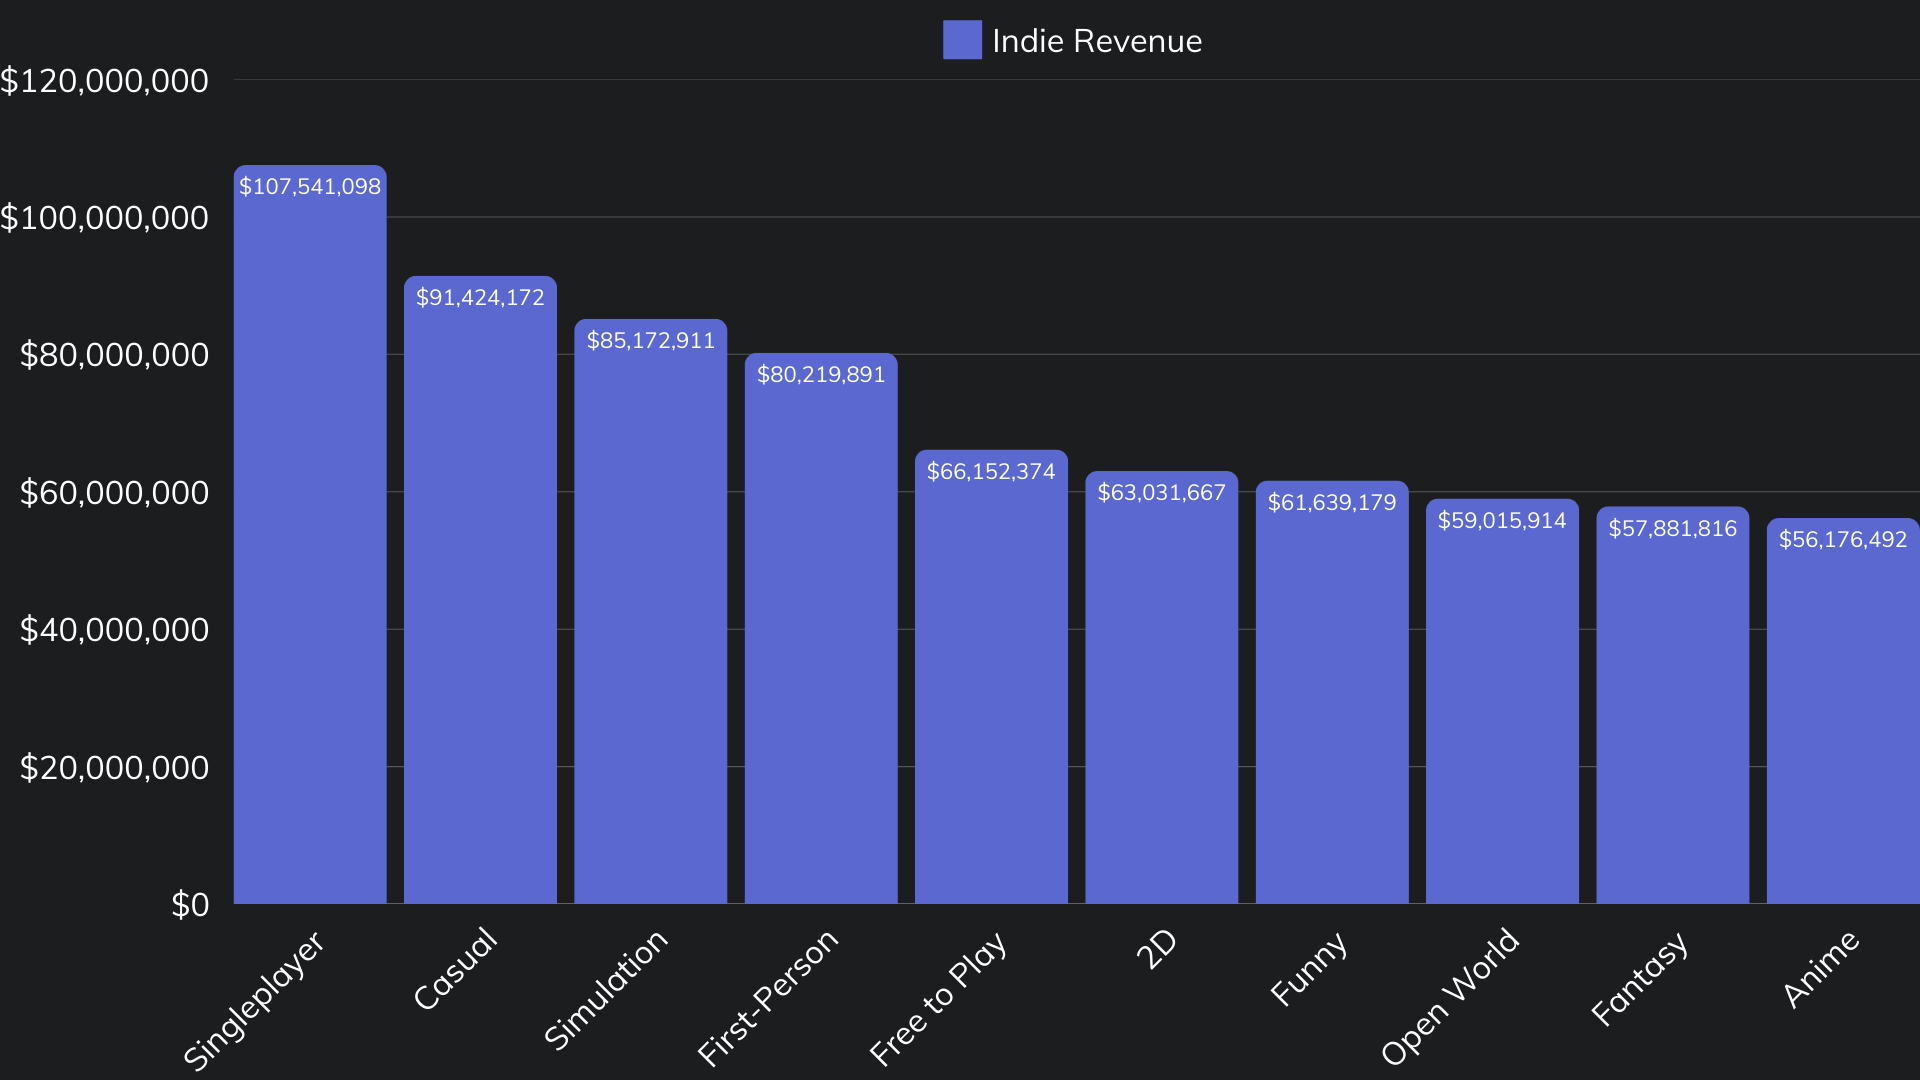
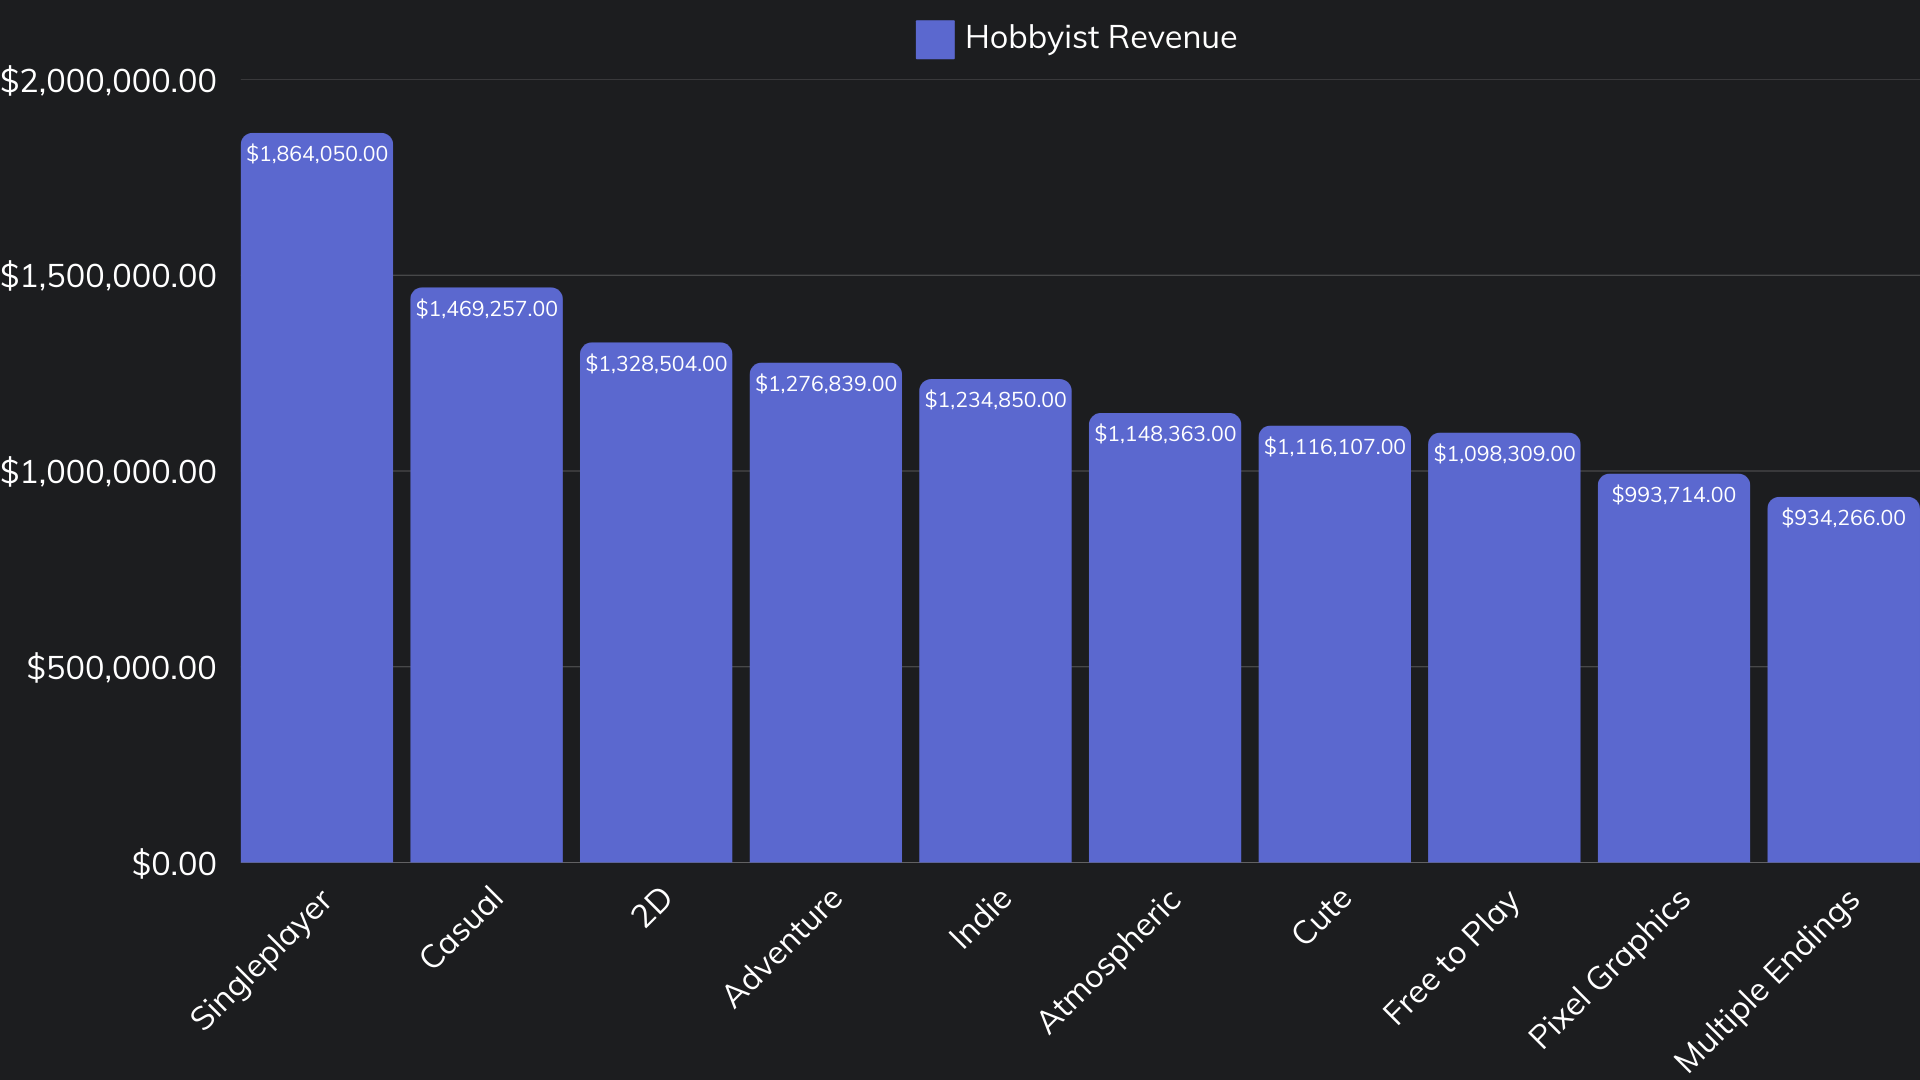
Key Genre Comparisons for AA, Indie, and Hobbyist Titles
Strong AA Genres: RPG, 3D, Action, Co- Op
Strong Indie Genres: First Person, Simulation, Open World, Anime
Strong Hobbyist Genres: Cute, 2D, Adventure, Atmospheric, Pixel Graphics
Most Common Genres for AA, Indie, and Hobbyist Titles
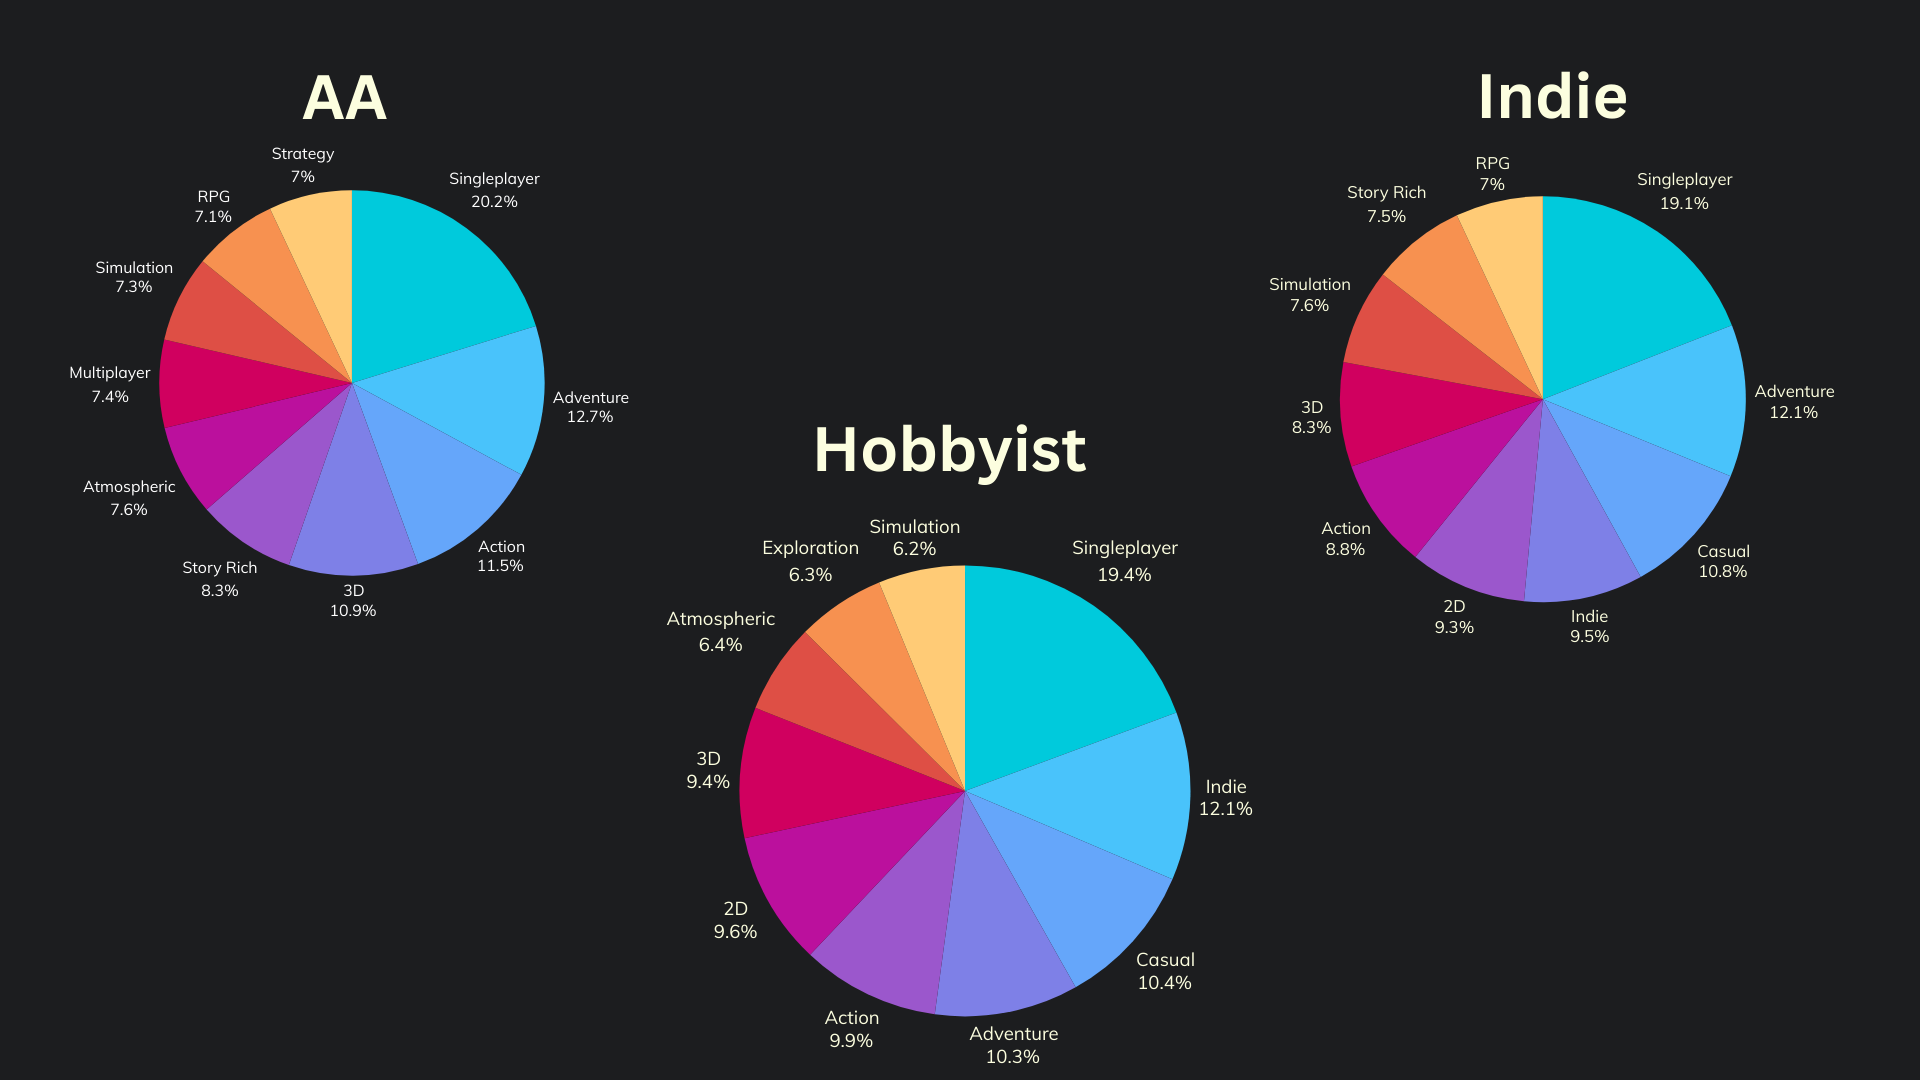
Genres that were in the most common chart but not the most profitable list.
AA: Story Rich, Atmospheric, Simulation, Strategy
Indie: Adventure, Indie, Action, 3D, Story Rich, RPG
Hobbyist: Indie, Action, 3D, Simulation, Exploration
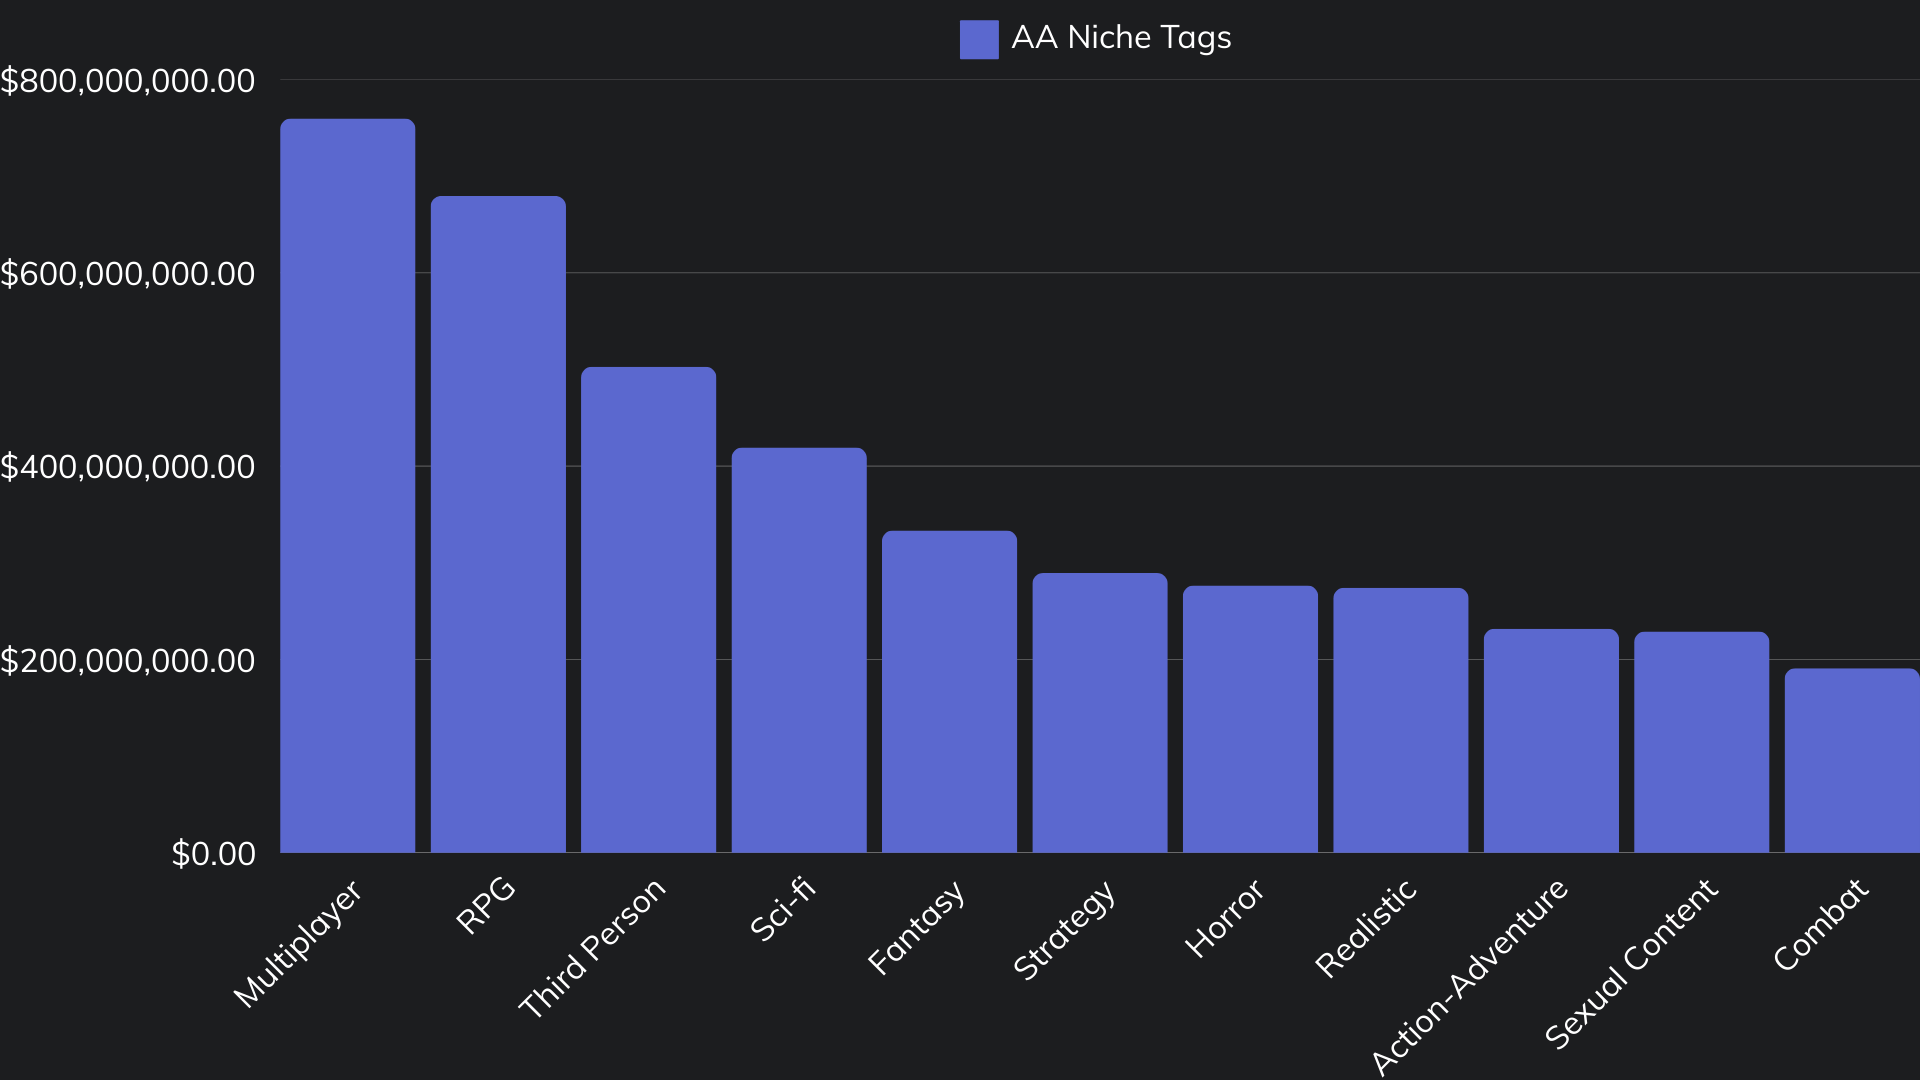
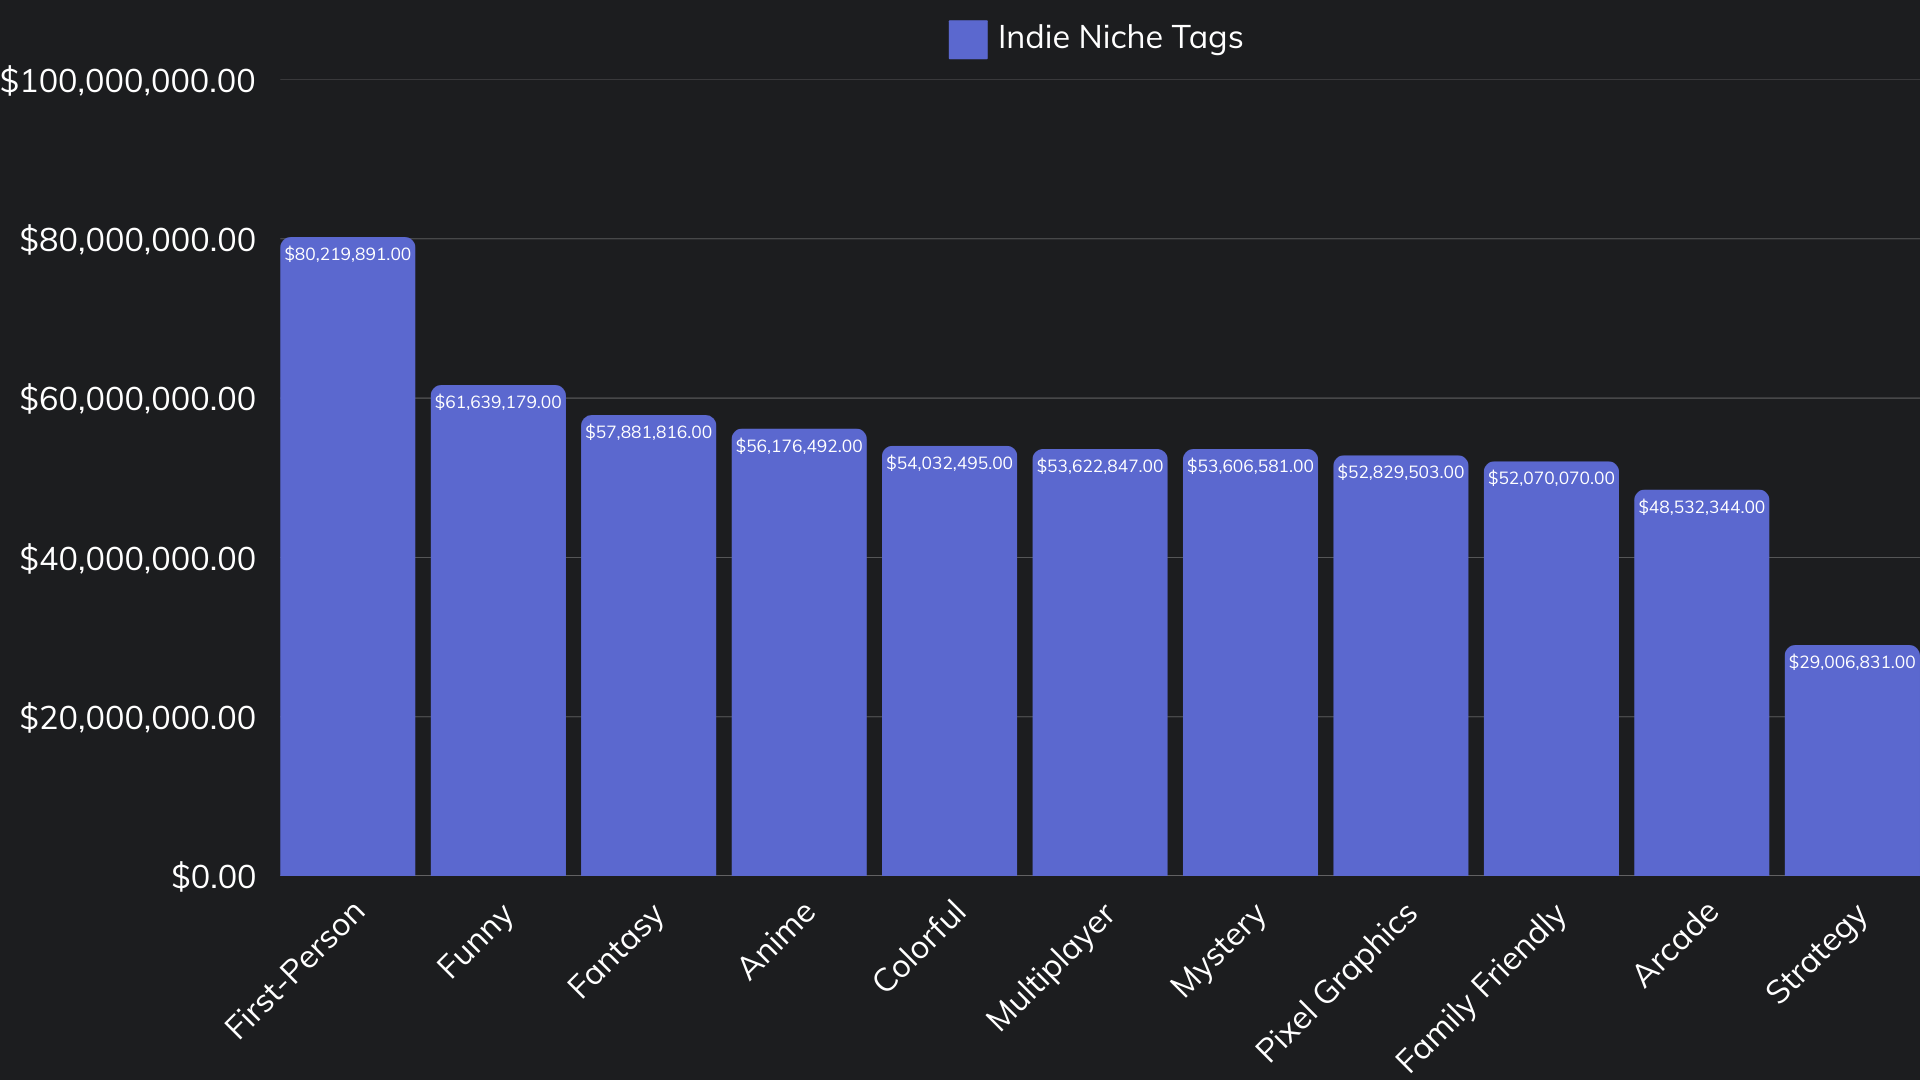
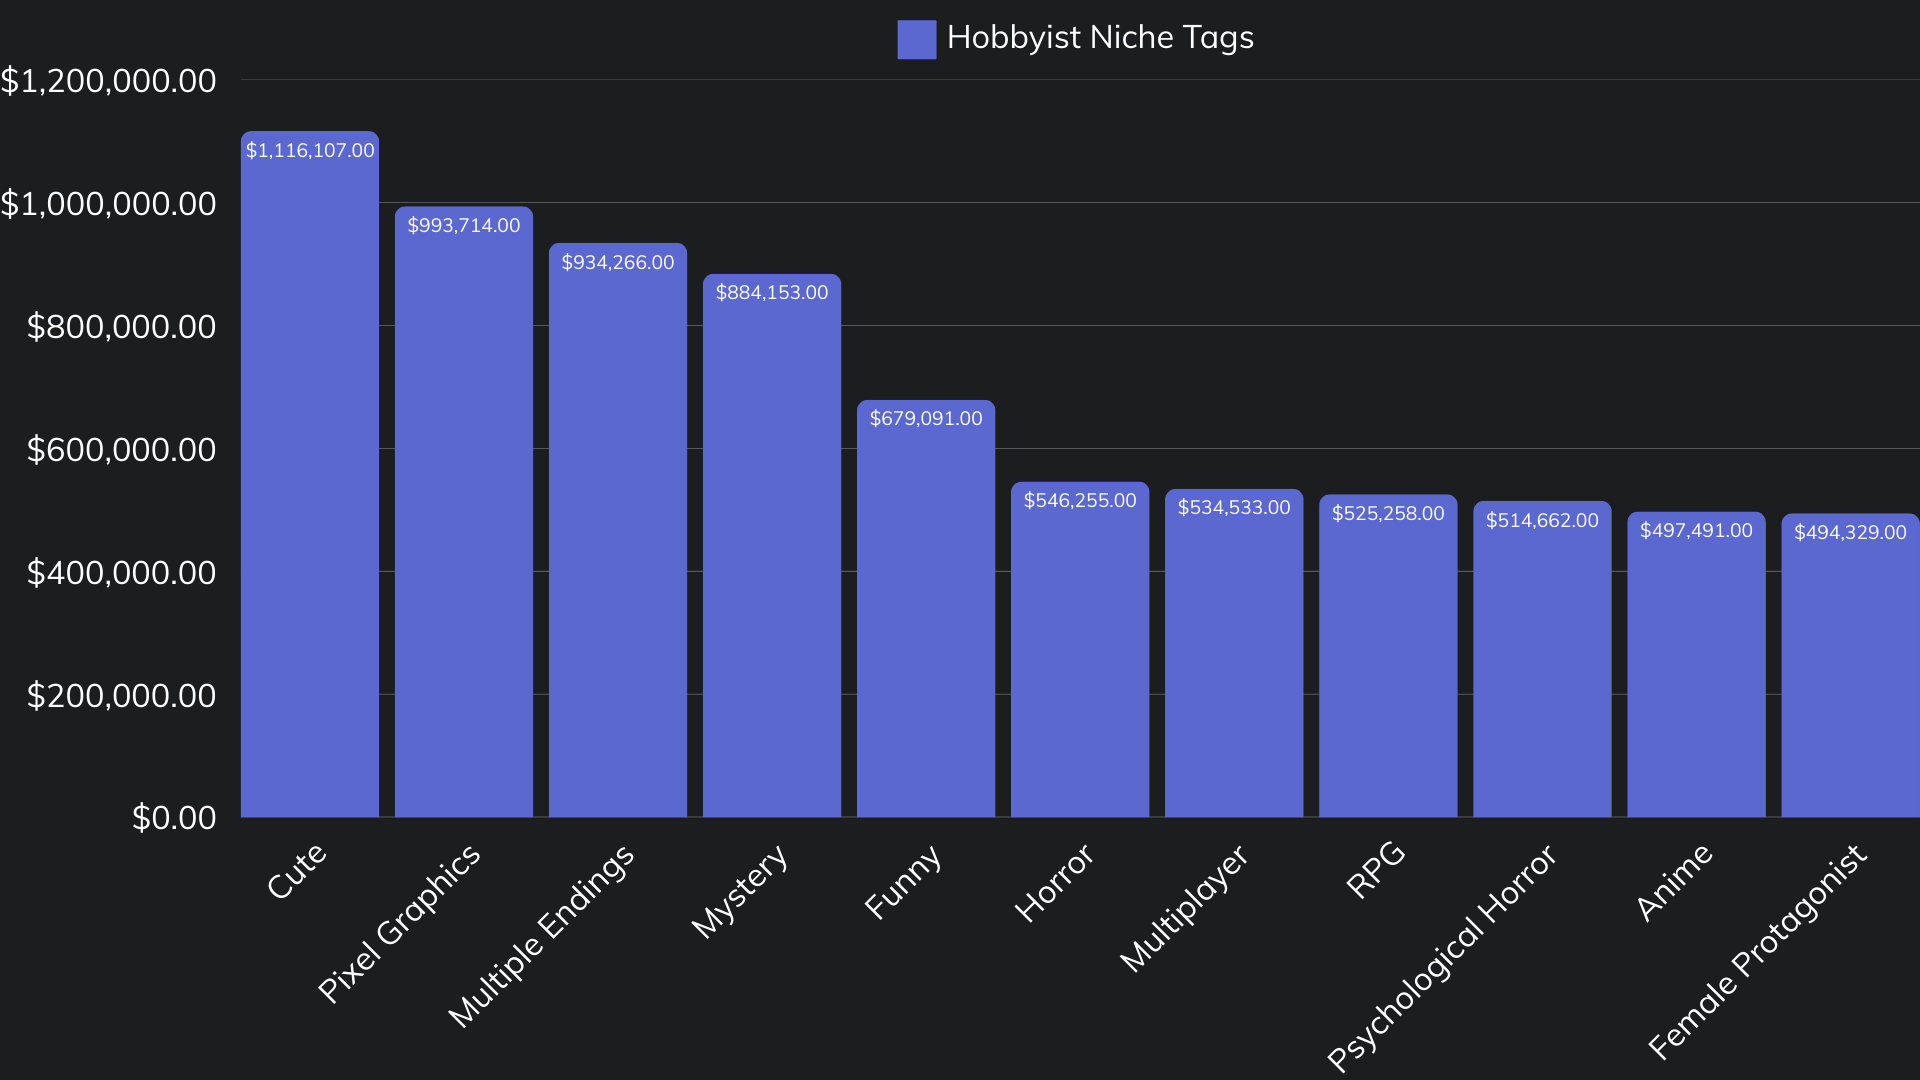
Emerging Niche Genres
These were used in 10% of games or less and in the top 50 revenue genres.
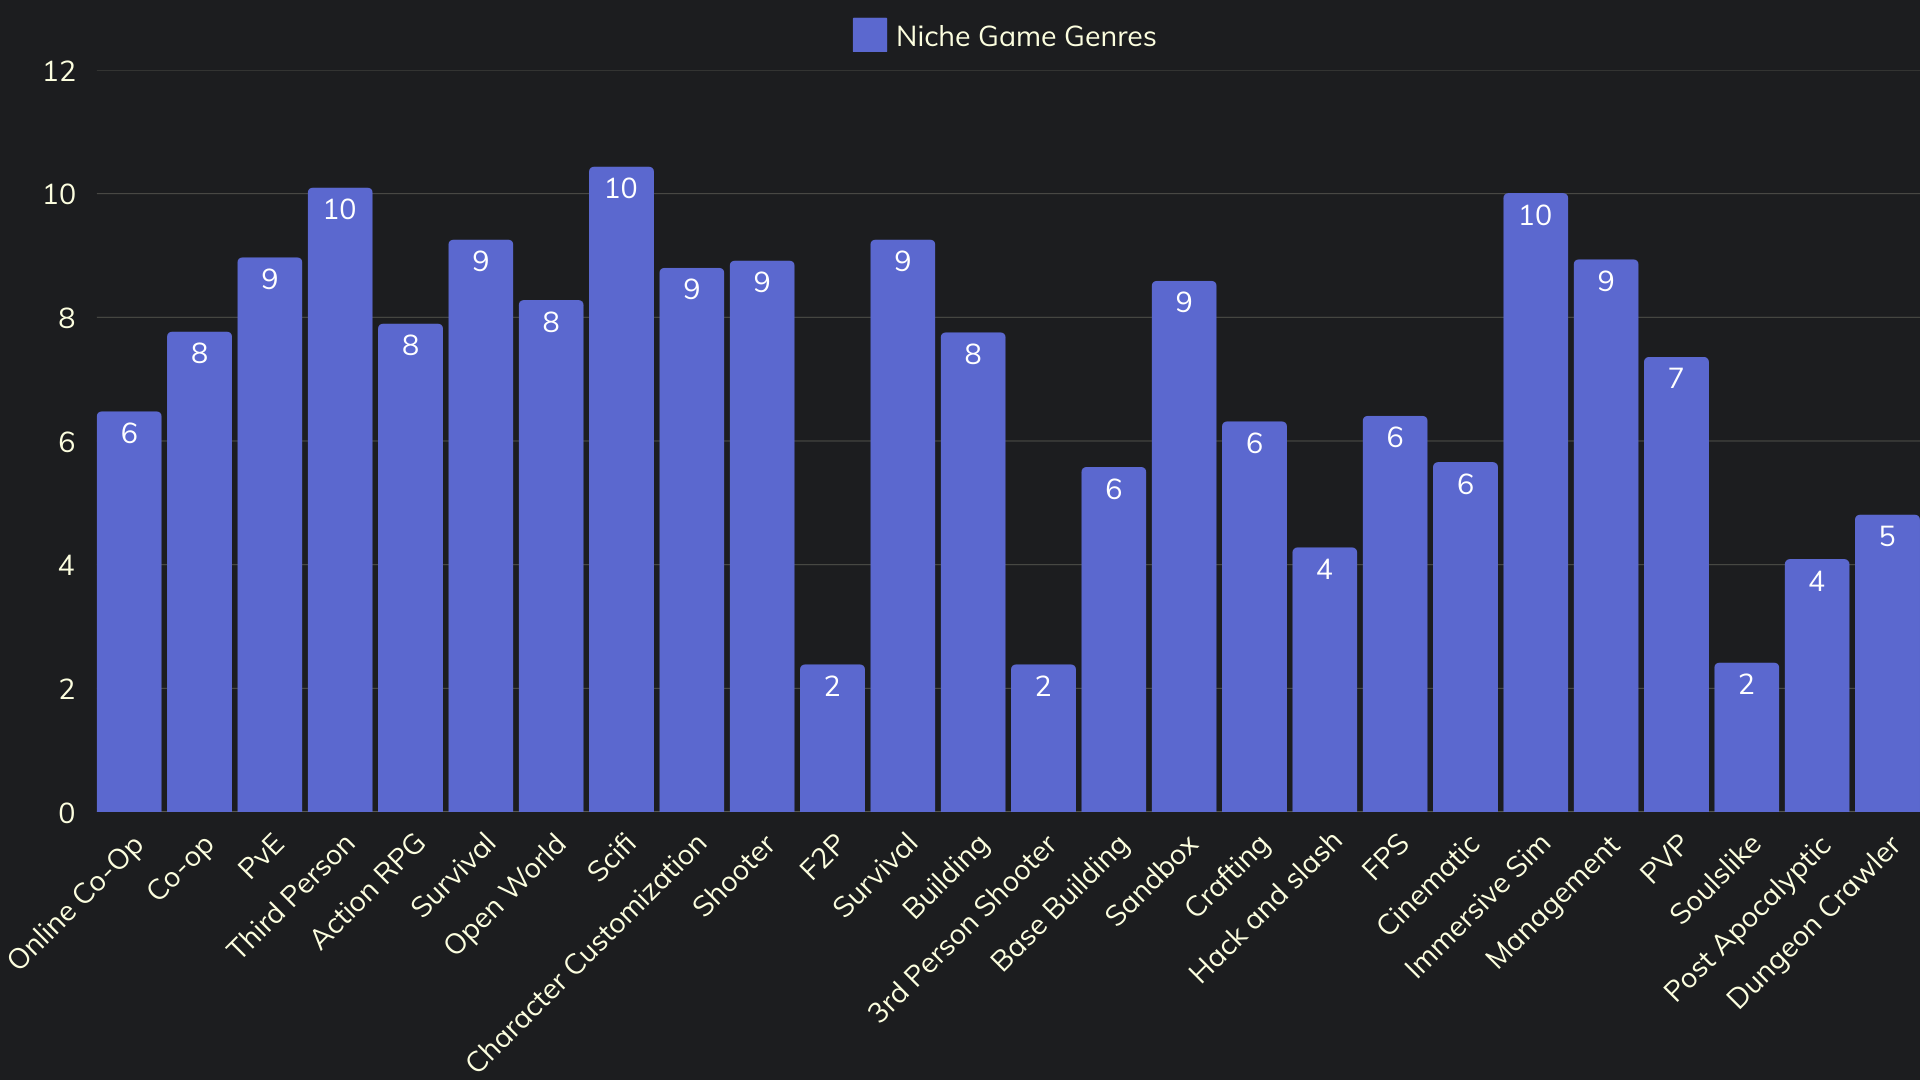
Most Profitable Niche Genres for AA, Indie, and Hobbyist
Expanding the search a bit more I opened up the range to 10-25% usage and separated it by AA, Indie and Hobbyist.
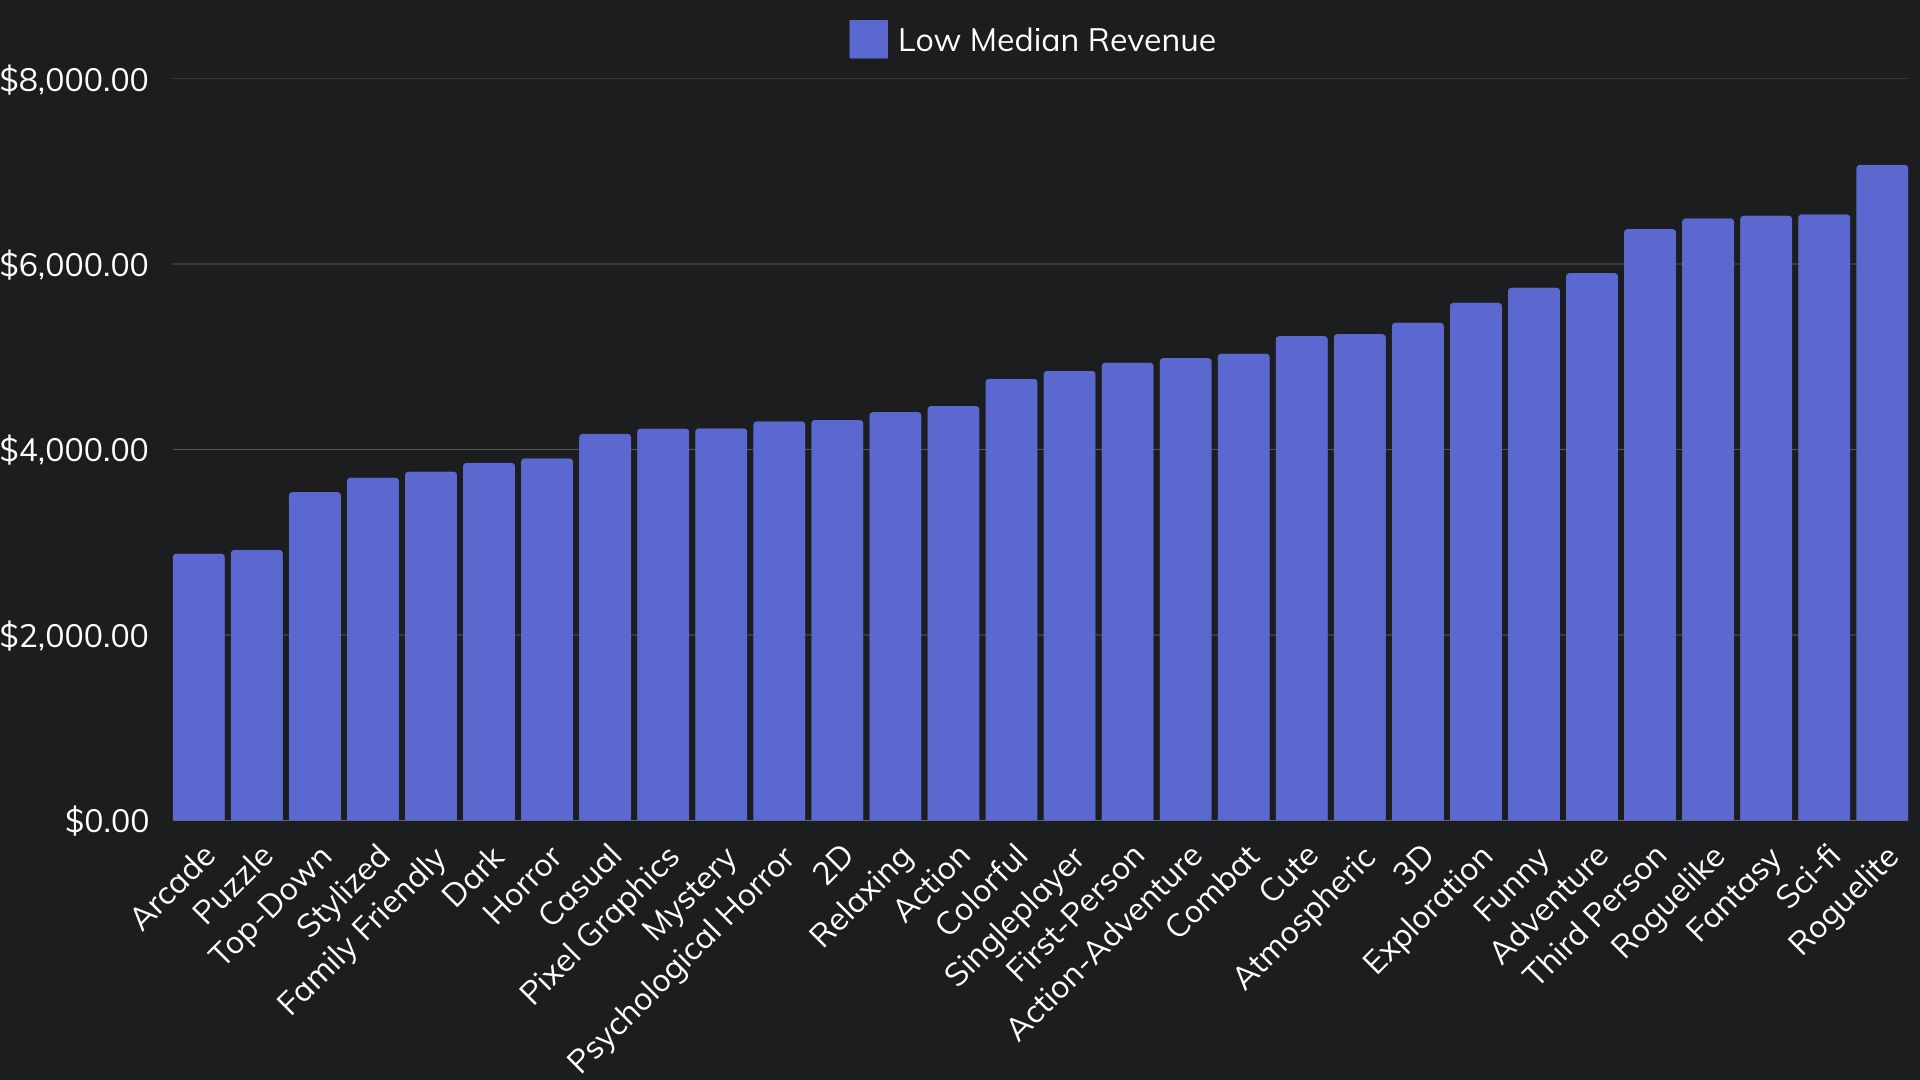
Sharing The Love Genres
These are the highest median revenue genres that were used in at least 10% of games. Having a high median revenue and usage rates reflects genres that perform predictably well.
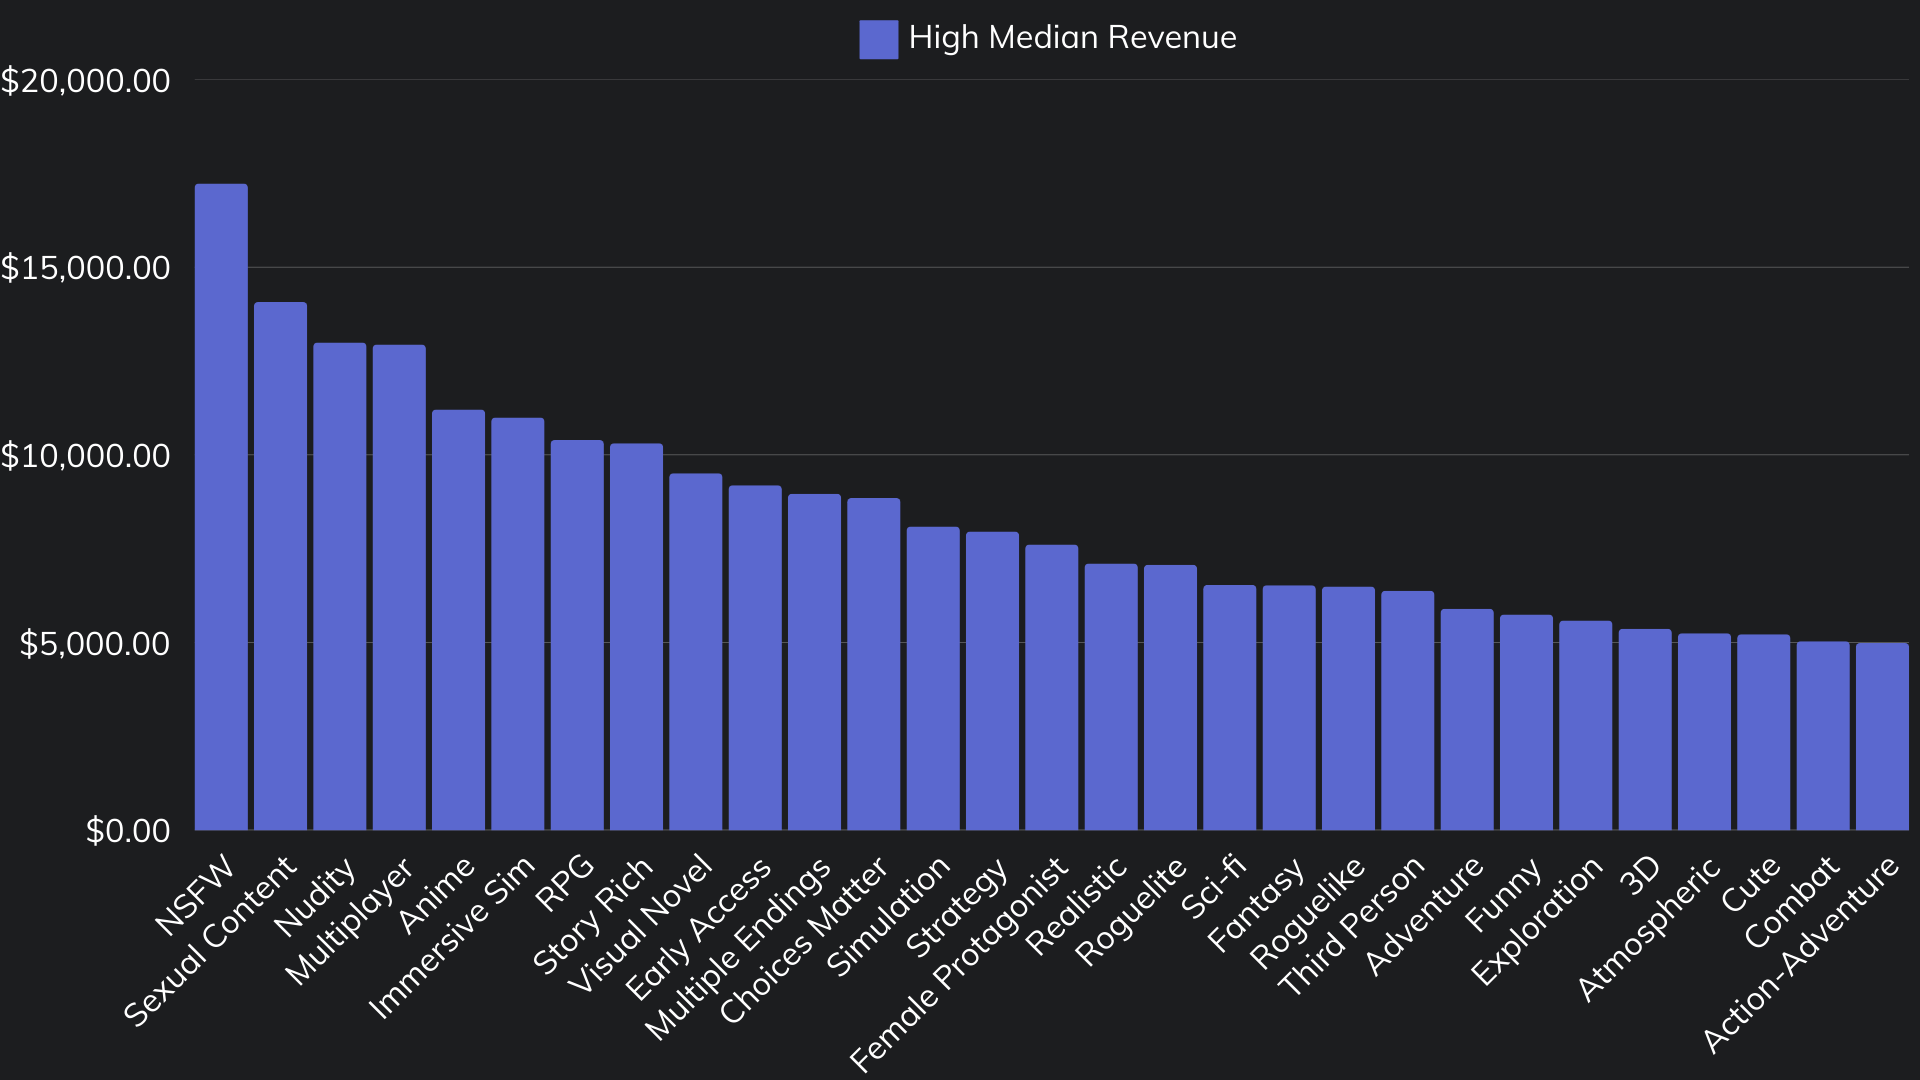
I’ll let you look at the combined genres of the left half of that chart and use your imagination to figure out why their consistently popular.
Tough Genres
These are the lowest median revenue genres that were used in at least 10% of games. Having a low median revenue but high usage rates doesn’t necessarily mean its not a lucrative genre but it does mean it has high competition and takes something special to stand out.
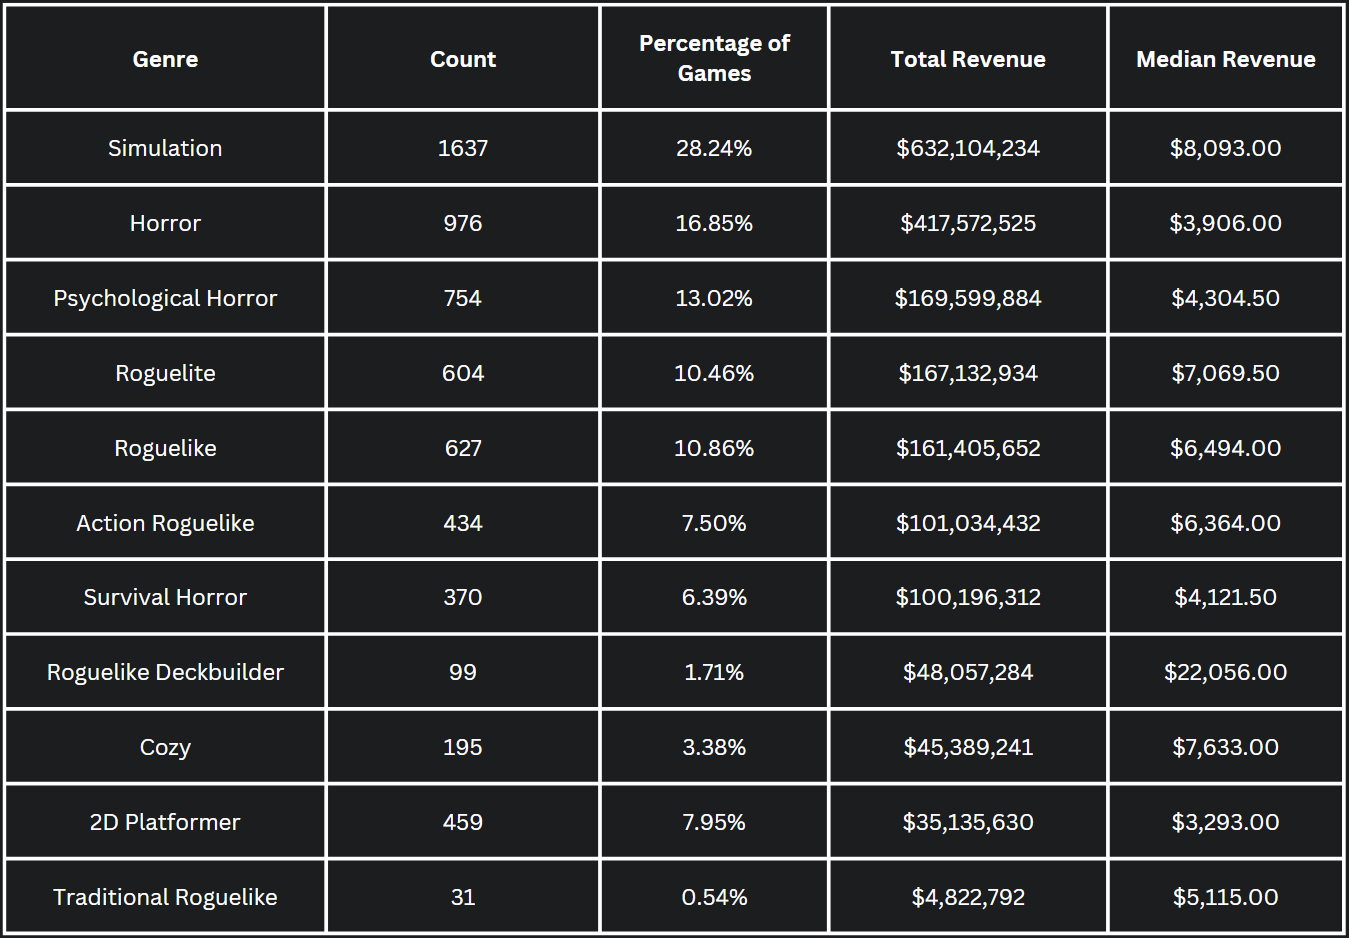
Random Genre Highlights
These are popular genres I often see debated, so I pulled the data to see what we can learn.
Simulation games are extremely popular and tend to do well.
2D platformers have one of the lower median revenues, reflecting the common knowledge of it being a popular but difficult genre.
Rougelikes/Rougelites are increasingly seeming like a genre that’s here to stay.
While less popular Rougelike Deckbuilders had a high median revenue.
Horror games were extremely popular with high total revenue but lower median revenue. This makes a lot of sense. At this point many have heeded the advice to make horror games on Steam but you still need a good game to rise to the top.
Conclusion
The data from 2024 highlights the stark realities of the gaming industry. While a handful of games achieve massive success, the majority struggle to make meaningful revenue. The winner-takes-all dynamic is clear, with the top 10% of games capturing the vast majority of revenue across all categories.
Ultimately, the key takeaway is that making games is challenging, but well-informed strategies can improve your chances of success. Whether you’re an aspiring Indie dev or a growing AA studio, learning from industry trends, and adapting accordingly is crucial to navigating the ever-evolving gaming landscape.
That’s two data heavy posts back to back, so next time we’re doing another case study on a successful indie game filled with actionable insights to market your own game to success. See you next time✌️
Depending on the data collection tool used, things like demos or Steam software/tools were counted as games, hence the “approx” 18,000.
Why $500? There’s no specific reason, it’s just an arbitrary number I decided on that reflects games that made at least a little money.
Revenue share can be anywhere from 20-70% depending on your contract.
tldr: get your f2p nsfw simulation game published, collect profits, got it. ✍️
Amazing article. Thanks for sharing!